Benchmarking of non-revenue water: experiences from South Africa
The South African Water Research Commission assists South African utilities in managing leakage, and has used leakage data to put together a comprehensive assessment of non-revenue water in the country. In the latest article from the IWA Water Loss Specialist Group, Jay Bhagwan, Willem Wegelin and Zama Siqalaba discuss the outcomes of South Africa's largest leakage assessment to date.
The South African Water Commission (WRC) has been providing support to municipalities throughout South Africa to address leakage wastage from their potable reticulation systems since the early 1990s. South Africa was one of the first countries outside the UK to fully recognise the benefits of adopting the Burst and Background Estimate (BABE) methodology that was initially developed by the UK water industry when the major water suppliers in England and Wales were privatised in the early 1990s.
Non-revenue water (NRW) measurement and benchmarking is one of the important interventions that WRC has been pursuing and developing over the years. Complementing this, WRC has supported the development of various models to help water suppliers to understand and ultimately reduce their leakage. These included the night-flow analysis model Sanflow (WRC, 1999), the pressure management model Presmac (WRC, 2001), the economics of active leakage control model Econoleak (WRC, 2002), and finally a model to assess the levels of NRW based on the IWA Water Balance.
All these initiatives have resulted in one of the largest and most comprehensive NRW assessments to date, which provides information on progress with NRW and benchmarking over the past five years.
Developments in NRW assessments
The initial NRW assessment in 1999 ultimately used only 20 datasets that were considered to be of an acceptable quality from a potential set of around 600 water suppliers. The assessment suggested that the average NRW for the 20 water suppliers was in the order of 25% with an average ILI value of 6.0. Most of the acceptable datasets were provided by the larger municipalities, which were the only water suppliers at the time that collected the appropriate base data and meter readings. As a result of this initial assessment, WRC commissioned a follow-up assessment in 2005.
In the 2005 assessment (WRC, 2005) information was obtained from 60 water suppliers. Thirty acceptable datasets were identified from these, representing nearly 50% of the municipal water supplied throughout South Africa. In this assessment the percentage of NRW was not calculated in line with the IWA recommendation, to avoid the use of percentages when dealing with NRW.
The ILI, which provides an indication of physical leakage, was however calculated for the 30 municipalities and an average value of 6.3 was derived. Once again, the value of the assessment was clear to WRC as well as the government, which commissioned a third assessment to be undertaken.
The third assessment was undertaken in 2007 (WRC, 2007). This involved 100 datasets, from which 62 were included in the final assessment, representing almost 60% of the total municipal water use in South Africa. In this assessment many of the smaller municipalities were included, and the average NRW was estimated to be 36%, with an average ILI of 7.6. The percentage of NRW was again included in the assessment despite the fact that it was accepted that percentage can be very misleading. Some of the high level committees were uncomfortable with the use of ILI and other recommended performance indicators, with the result that percentages were used, albeit with a 'health warning' to highlight that they can be misleading in certain cases.
The 2012 NRW assessment
Following the success of the 2007 assessment in raising the issue of NRW to the national platform where it was discussed at length by government, a fourth assessment was undertaken between 2010 and 2012, the results of which were officially released in March 2013 (WRC, 2012). This is the most comprehensive and detailed assessment of NRW undertaken in South Africa, and involved water balance information from more than 130 municipalities. The project was supported not only by WRC but also the Department of Water Affairs (DWA).
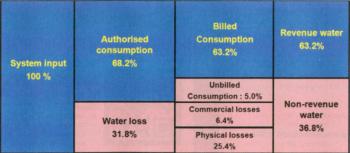
The data gathered from 132 of the possible 237 municipalities supplying water to more than 40 million residents throughout South Africa represents over 75% of the total volume of municipal water supplied. The results indicate that the current level of NRW estimated for the country is almost 37%, with an average ILI of 6.8.
The NRW figure for South Africa is similar to the estimated world average of 36.6%, but is considered high in comparison to developed countries and low when compared to developing countries. Once again, it must be stressed that percentages can be misleading and the values provided in Figure 1 should therefore be used with caution. The ILI of 6.8 is considered to provide a realistic indicator of physical leakage for the South African systems and it is interesting to note that the various estimates of ILI over the past 12 years have all been between 6 and 8. Again, this would be considered high for most developed countries but low for most developing countries and highlights the fact that levels of physical leakage are generally high in South Africa.
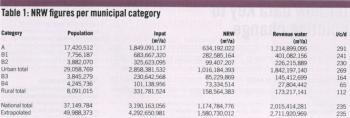
It should be noted that in South Africa, every water supplier is categorised according to the size of the population supplied and whether the area is urban or rural. The results from the breakdown into the different categories are provided in Table 1.
For the purposes of this study, an estimated total urban and rural consumption of approximately 4300M.m3/year was considered more realistic and this figure was used in the calculations as shown by the extrapolated values in the last row of Table 1.
Conclusions
The latest NRW study undertaken for WRC and DWA represents a major advance in the understanding and assessment of water losses from municipal water supply systems in South Africa. It is the most comprehensive assessment yet undertaken, and despite the many problems experienced with data collection from many of the smaller municipalities it was possible to gather information for more than 75% of the water supplied throughout South Africa. The overall NRW for South Africa is estimated to be 1580M.m3/year which is approximately 33% of the total water supplied. This conservatively represents a loss of over R7 billion (almost $1 billion) based on an average bulk water tariff of approximately R5/m3.
The average ILI value for all of the South African municipalities was estimated to be 6.8, which again is in line with the world average and would be above average (that is, bad) when compared to most developed countries and well below average (that is, good) when compared to most developing countries. Effectively, the ILI value of 6.8 tends to support the perception created by the percentage NRW figures for South Africa (36.8%) that there is clearly a high level of wastage or water losses in the country and considerable scope for improvement.
The attached table of figures are based on the standard IWA Water Balance in which the 'revenue water' figures provided by the financial departments are assumed to be correct. In South Africa, however, there can be a significant component of revenue water that is never paid for by the consumers. Preliminary estimates of this component suggest that if it is taken into account the level of NRW may increase by up to 10%. Investigations are continuing to try and quantify this element with greater reliability, so that the next assessment can provide a more complete and accurate water balance.
References
WRC (1999), Development of a standardised approach to evaluate bursts and background losses in water distribution systems in South Africa: SANFLOW. Report TT109/99, by Mckenzie R to the South Africa Water Research Commission, June 1999. ISBN 1 86845 490 8
WRC (2001), Development of a pragmatic approach to evaluate the potential savings from pressure management on potable water distributions in South Africa: PRESMAC. Report TT152/01 by Mckenzie R, published by the South African Water Research Commission, July 2001. ISBN 1 86845 722 2
WRC (2002), Development of a Windows-based package for assessing appropriate levels of active leakage control in potable water distribution systems: ECONOLEAK. Report TT 169/02 published by the South African Water Research Commission, April 2002. ISBN 1 86845 832 6.
WRC (2002), Development of a simple and pragmatic approach to benchmark real losses in potable water distribution systems in South Africa: BENCHLEAK. Report TT159/01 by Mckenzie R and Lambert A, published by the South African Water Research Commission, January 2002. ISBN 186845 773 7
WRC (2005), Benchmarking of leakage from water reticulation systems in South Africa. Report prepared for the WRC by Mckenzie R and Seago CJ. Water Research Commission Report TT 244/05, ISBN 1 77005 282 8.
WRC (2007), An assessment of non-revenue water in South Africa. Report prepared for DWAF and the WRC by Seago CJ and Mckenzie R. Water Research Commission Report TT 300/07, ISBN 978 177005 529 2.
WRC (2012), The state of non-revenue water in South Africa. Report prepared for DWAF and the WRC by Mckenzie R, Siqalaba Z and Wegelin W. Water Research Commission Report TT 522/12, ISBN 978 1 4312 0263 8.
